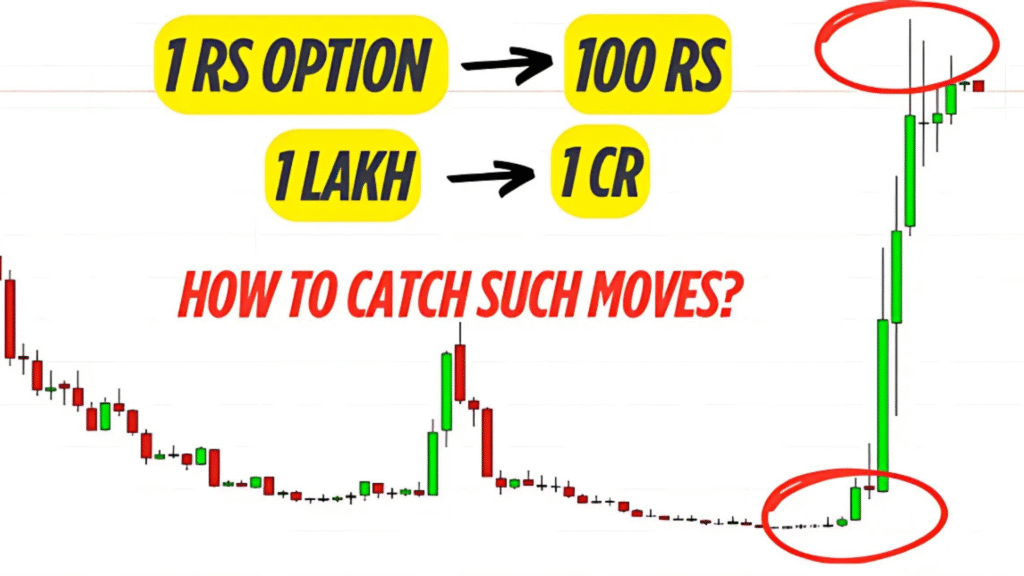
Hero or Zero Strategy: How a 1 Rupee Option Became 120 on Expiry Day
Trading options on expiry day can sometimes feel like holding a lottery ticket. Ever heard of Option premium turning ₹1 into ₹100 in minutes? i.e. 100 times! That’s the magic of “Hero or Zero” trades — where cheap, expiry day options explode in value especially in the late-afternoon. But what if you had the skill to catch those rare explosive moves that can turn a few rupees into lakhs within minutes? Hero or Zero trade Example: 16th May 2024 Nifty Expiry The Big Move – 16th May Nifty Expiry Nifty was sliding for most of the day on spot chart( in the above chart) But around 2:15–2:20 PM, something changed. It broke above the 20 EMA line (on the spot chart) and made a strong 300-point rally, eventually closing near 22,422. Simultaneously, On the options chart(given above) 22,100 CE option was trading around ₹25–₹26 just before the breakout. Within minutes, it shot up to ₹320. That’s a 12x return. If you had invested ₹10,000, it could have turned into ₹1.2 lakh in a flash. If you had the nerve to hold onto ₹1 lakh, you might’ve walked away with ₹12 lakh. This Isn’t Just Luck — It’s a Setup Let’s be clear — this isn’t really gambling. This is a chart-based, high-risk strategy. And it can only work under certain strict conditions. That’s exactly what happened on 16th May on Nifty’s expiry day. (And that is what I am going to me break it down in this blog — what triggers this kind of massive move, how a single breakout can change the entire game, and how someone could’ve turned a 1-rupee option into a 120-rupee jackpot in a matter of minutes) ⚠️ Disclaimer: This strategy has a low win rate. It behaves much like buying a lottery ticket — most of the time, your investment will go to zero. However, when it works, the payoff can be massive. Do not use borrowed money or your core capital. Only risk a small amount and what you’re willing to lose completely. Another example of Hero or Zero trade: 30th April 2024 Fin Nifty Expiry 30th April 2024 Example FinNifty was in a strong up trending on 30th April(in the above chart). And around 2:30 PM, it suddenly reversed and closed below the 20 EMA. In the above options chart, ATM 21400 Put Option surged from ₹10 to ₹250 — a 25x move in just minutes. That’s the true power of Hero or Zero trades. On expiry days, even the cheapest options can explode in value within minutes, turning small bets into massive gains. Now, let’s break down the Hero or Zero strategy into clear, actionable conditions so you understand when and how to trade it effectively, especially on expiry days. Strategy Conditions: Applicable only on expiry days Can work only in the late afternoon (ideally after 2 PM) No Stop Loss — because you’re already risking only a few rupees Entry only if- It’s a trending day or even tight sideways day Price closes above 20 EMA in a downtrend or below 20 EMA in an uptrend (in late afternoon) Option premium in single-digit (preferably below ₹10 or 5) You pick ATM or slightly OTM options Why No Stop Loss in Hero or Zero trades? If you’re buying a ₹2 option and placing a stop loss at ₹1, you’re already halfway to zero. In this strategy, you mentally accept a 100% loss before entering — because if it works, the reward is asymmetrical. Another example of Hero or Zero trade: 9th Jan 2024 Fin Nifty Expiry Sideways Day Setup – 9th Jan 2024 (Fin Nifty Expiry) In the above chart, on 9th January 2024, Fin Nifty was a tight-range and it was a sideways day, and suddenly Fin Nifty broke a strong support post 2 PM with a full body red candle. And now let us see below what happened with two different options strikes. In the above given options chart, ATM PE 21400 went from ₹10 to ₹250 around 25x, but OTM PE 21350 from ₹2 to ₹200, almost 100x So, why did different strike prices give different returns?That’s exactly what we’ll cover next — How to choose the right strike price for expiry day Hero or Zero trades. Which Option to choose? ATM or ITM or OTM? ATM vs OTM vs ITM Returns on 16th May Nifty Expiry Day (Breakdown of Option charts) In above given Nifty chart of 16th May 2024, we saw a strong rally in the late afternoon. Now, using the different option charts below, let’s break down how different strike prices reacted and how their premiums moved during this rally. Strike Entry Price High Price Return 22,100 CE(ITM) ₹15-16 ₹320 ~12x 22,200 CE (Slightly OTM) ₹8 ₹220 ~28x 22,250 CE(OTM) ₹3 ₹170 ~55x 22,300 CE (slightly far OTM) ₹1 ₹120 120x But if you went for too far OTM like 22,450 CE, you lost your premium — it expired worthless. Because Nifty spot expired below 22450 level on spot chart. Points to be noted here: ATM options may not give 100x or 200x, but chances of wins are slightly higher if direction goes right. Slightly OTM options can give good risk reward trades like 20x 50x and win rate slightly better Slightly far OTM can give like 100x kind of returns but very low chances of wins. Too far OTM better to avoid because most of the time it becomes zero. It is important to note that spot must close above that option strike at the time of expiry, otherwise that option becomes zero (like in the 22450 CE chart) The Psychology Behind these big moves Most option sellers assume expiry premiums decay linearly — from ₹50 to ₹40, to ₹30, and so on. When an option hits ₹5 or 10, they think it’s safe to sell and it becomes zero. But when a breakout hits and price jumps from ₹5 to ₹20 to ₹50 — panic sets in. Sellers start covering, which amplifies the move. This


