From 2003 to 2025: Two Decades of Market Lessons
I didn’t become a full-time trader overnight. Though I became full-time trader in 2019, my trading journey started way back in 2003–2004.
It’s been over 20 years of staring at charts, burning the midnight oil, and riding through market storms. Some years were good; but others felt like falling into a financial disaster.
Why I Decided to Share This Story Now
Because if my 20 years of pain, mistakes, and breakthroughs can stop you from taking just one random trade, it’s worth it.
I’ve been where you are. I’ve gambled. I’ve panicked. But I’ve also learned the hard way—and that learning is what I want to pass on in this article.
This blog post is a culmination of those hard-learned lessons and two decades of chart-watching.
It’s a guide designed to help you avoid the pitfalls I fell into—and most importantly, to introduce you to high-probability price action patterns that I’ve personally tried and tested over the years.
The Early Days: Trading Without a Plan
The Lure of Quick Profits:
Back in the day, I used to enter trades without a second thought. If it looked exciting, I was in. No chart analysis. No logic. Just pure emotion.
And guess what? Sometimes it worked. And that “sometimes” was dangerous—it made me believe I got a holy grail and I was on to something.
The Painful Consequences of Random Trades:
But randomness catches up. And it caught me big.
I’d be up ₹5,000 one day, but down ₹20,000 the next. Why? Because there was no system. No setup. No risk management, Just chaos disguised as confidence.
When I reflect on the common thread behind those losing trades, one thing stands out loud and clear: random trading.
I didn’t wait for confirmed setups. I chased price. I acted out of impatience. Simply put, I gambled.
Turning Point in year 2017: Realizing the Power of Price Action and having a system
What Changed in 2017?
That’s when I made the shift. I stopped treating the trading like a gambling. I began journaling, studying patterns, analysing what worked—and more importantly, what didn’t.
The First Steps Towards Discipline
I discovered price action. It was like someone turned on the lights in a dark room. The charts started to speak. And I started to listen…
The Role of Historical Charts
Saving Every Nifty & Bank Nifty Chart Since 2018
Since 2018, I’ve saved every single Nifty and Bank Nifty chart on 5 minute time frame. Organized day-wise, month-wise, year-wise.
This isn’t obsession—it’s dedication. Those charts are the treasure chest of my trading wisdom.
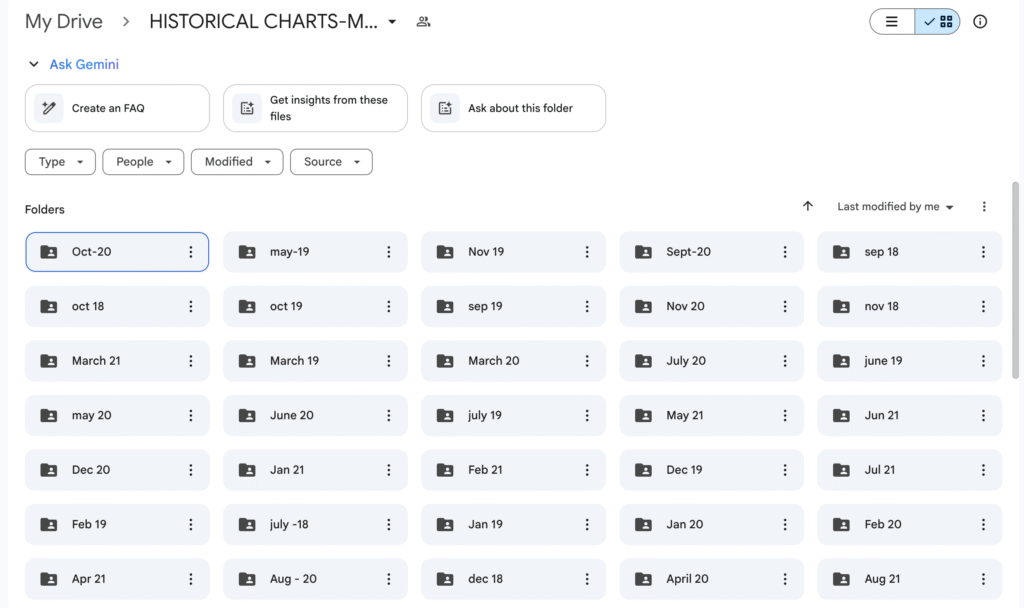
I have folders filled with day wise/month wise Nifty and Bank Nifty charts on 5 minute time frame (as you can see in the below image).
It’s like my personal trading diary, except it’s all visual.
These charts have been my teachers. They’ve helped me study, back test, and identify patterns that work consistently. If you were to open any folder, you’d find charts labelled by date—July 2019, October 2020, and so on—each one telling a story of price action in motion.
It’s proof that some patterns work consistently—not 100% of the time, but often enough to build a strategy around.
Discovering High-Probability Setups
The high-probability patterns I’m about to discuss are not theoretical. They’re not copied from any textbook. They’re based on real setups, and real observations collected over years of screen time.
And let me be clear—these patterns are designed specifically for Nifty and Bank Nifty. They won’t necessarily work the same way in commodities or individual stocks.
So, without any more delay, let’s get into it. Let me show you the price action patterns that have stood the test of time—so you can stop trading randomly, and start trading with purpose.
Strategy 1 – Initial Balance Price Action Pattern: A High-Probability Intraday Trading Setup
After nearly two decades of market observation and full-time trading since 2019, I’ve found that one of the most reliable and high-probability setups is based on what traders call the Initial Balance—the price range created during the first hour of market opening.
What is Initial Balance (IB)?
Initial Balance can tell you if the market is likely to trend or remain range-bound for the day.
Initial Balance (IB) refers to the range between the high and low of the first trading hour (In the Indian stock market context, this means tracking the price movement from 9:15 AM to 10:15 AM)
Initial Balance High (IBH) = The highest price reached between 9:15 and 10:15
Initial Balance Low (IBL) = The lowest price reached between 9:15 and 10:15
Why Initial Balance Matters in Intraday Trading
Here’s why this setup is a game-changer:
Market Tends to Stay Sideways most of the time : Studies and personal observations show that 60% to 70% of the time market trades within a range throughout the day.
Trending Days are Rare: Only 20% to 30% of trading sessions witness strong trending days.
Reversal Points: The boundaries of those Initial Balance range often act as support and resistance zones, providing traders with potential reversal points.
This makes the Initial Balance strategy perfect for range-bound intraday sessions(on wide Initial balance days)
Step-by-Step Guide to Trading the Initial Balance Setup
Let’s break it down with precision and clarity.
Step 1: Identify and mark Initial Balance
Wait until 10:15 AM after market opens at 9:15 AM.
Mark the High and Low of this one-hour range on your chart. These two lines now become zones of interest for the rest of the day.
Step 2: Classify the Initial Balance range
Wide vs. Narrow Initial Balance
A wide IB(initial balance) suggests sideways movement. A narrow IB(Initial balance) indicates possible breakout.
Why this matters:
On wide IB days, price tends to retest the IB boundaries, creating prime reversal opportunities.
On narrow IB days, breakouts from this ranges are more likely.
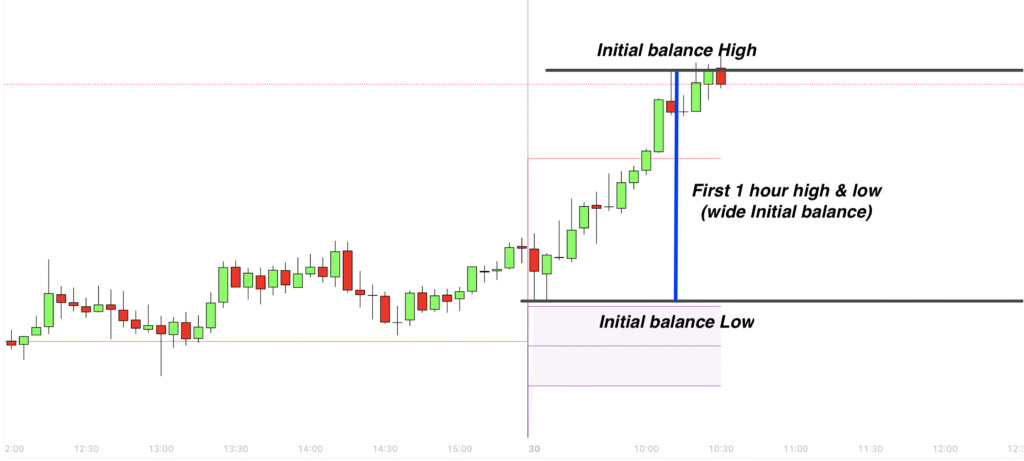
Example: In below image, On 30th January (Nifty), the market opened around 23,176 and the high at 10:15 AM was around 23,301. That’s a 125-point Initial Balance range(first one hour high and low, which is relatively wide initial balance so high chances of Nifty staying rangebound for the day
Step 3: Wait for a Retest of the IB Zones(Only on wide Initial balance day)
Here’s where patience pays.
For Long Trades: Wait for the price to come near the Initial Balance Low.
If it shows signs of support (e.g., bullish candlestick like hammer or bullish engulfing), take a long trade.
For Short Trades: Wait for price to re-approach the Initial Balance High.
If resistance holds and a bearish pattern appears (e.g., bearish shooting star, full body candle), take a reversal trade.
Step 4: Place Your Trade
Entry: After confirmation candle at the Initial Balance zone.
Stop Loss: Just below/above the IB line depending on trade direction.
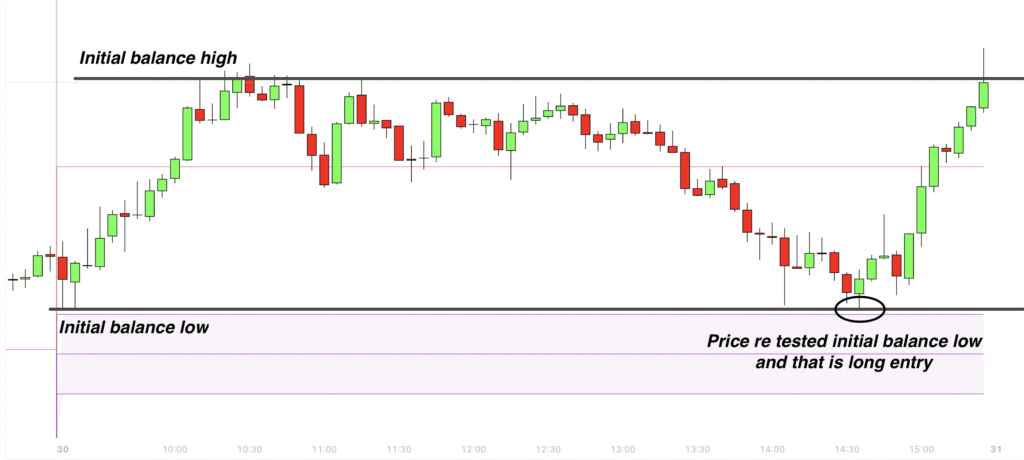
Example: In the below image, on 30th Jan, later part at around 2:30 PM, Nifty finally retested the IB Low from the morning. A clear bullish candle appeared, signalling a long entry.
By market close at 3:30 PM, the price had bounced back significantly—hitting the target beautifully
Note – For this set up example, only wide initial balance range set up is considered
Strategy 2 – Parabolic Move Trap: A Powerful Reversal Price Action Strategy in Intraday Trading
“This is one of the Most Common Trap in Intraday Trading”
Traders are emotional beings. And the market knows it.
When you see:
A big green candle
Followed by another big green then another green candle
Then a bigger green…
Your brain screams: “It’s going to the moon! I can’t miss this!” And that’s when you jump in.
But what often happens? The next candle turns red and it reverses. Your stop loss hits.
And you’re left asking, “Why does this always happen to me?”
Have you ever found yourself entering a trade at the peak of a rally, only to watch the market reverse immediately and hit your stop loss?
Or maybe you jumped into a sharp fall thinking, “This market is crashing,” and seconds later, it reversed and bounced back hard, trapping your short?
This is one of the most common patterns that traps intraday traders, especially during the first few minutes after market opens.
After observing this for years, I can tell you with confidence: strong parabolic moves—either up or down—are usually traps especially when they occur without any strong fundamental reason or any strong events.
The market lures you in with what looks like a big rally or a big crash—and then reverses just when you commit. That’s the trap.
How to Trade the Reversal (on parabolic opening day)
Here’s the correct way to approach a parabolic trap:
Step 1: Recognize the Parabolic Pattern
On your 5-minute chart, spot 3 or 4 or more consecutive big candles(same colour candles) in one direction right at the opening.
No retracement or pullbacks = strong indication of a parabolic trap.
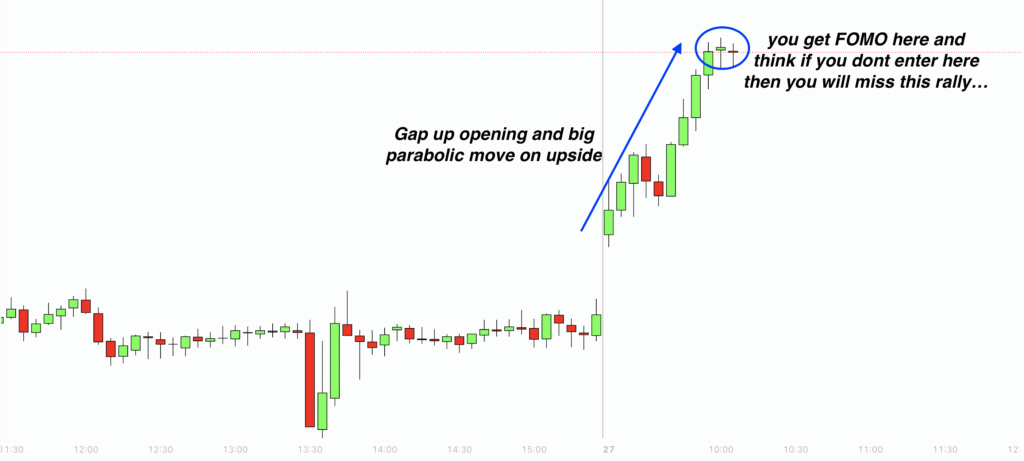
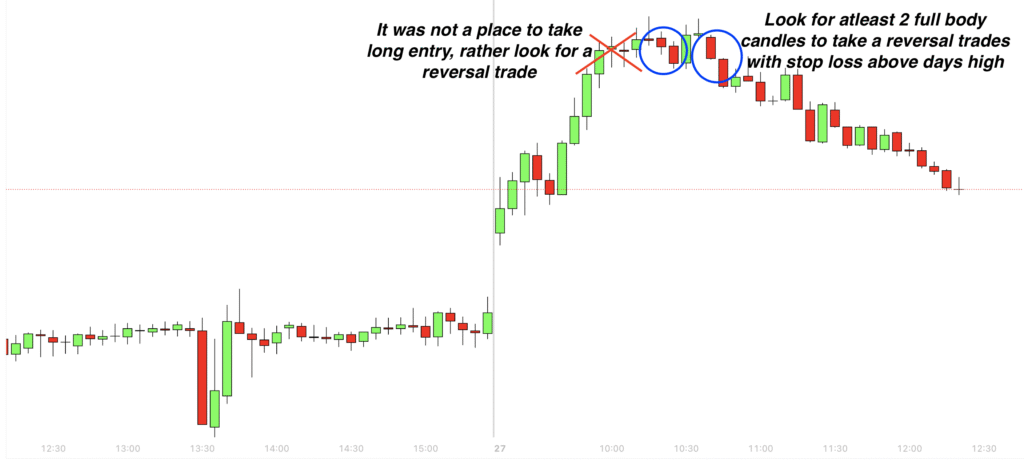
Example: in the image below, 9:15 AM – 10:15 AM: Nifty surges with parabolic move with back-to-back bullish candles and that gets FOMO…
Step 2: Wait for a Reversal Confirmation
DO NOT jump in early or counter-trade without a valid signal. Here’s what you wait for:
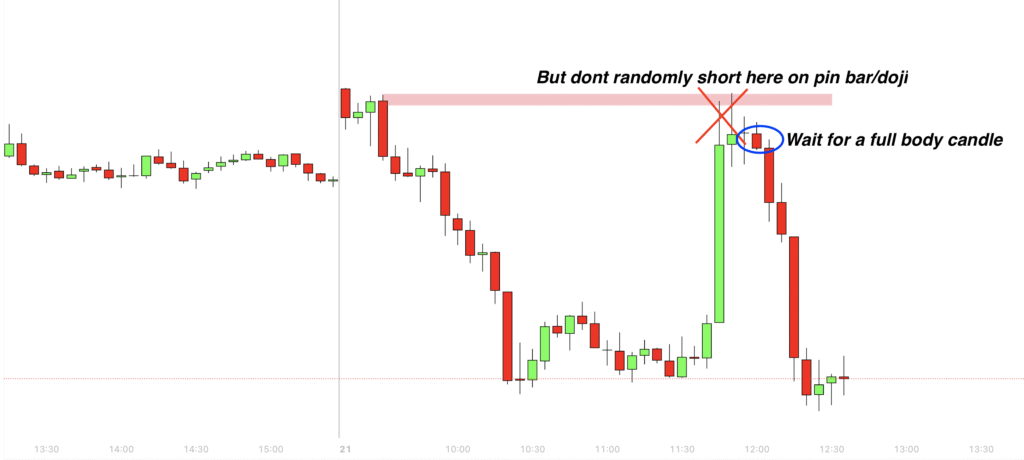
At least 2 consecutive opposite candles with full body candles on 5 min time frame, after parabolic move
Ignore pin bars or dojis, only full body candles
Example: In the image below, Around 10:15 AM: Two strong bearish candles appear, You can enter a short trade after the second bearish candle, Price falls steadily for the next hour, Target hits with precision
This is how professionals trade. Patiently. Calmly. And with a high-probability setup.
Step 3: Entry and Stop Loss
Short Trade: After 2 solid back to back red candles in a bullish parabolic trap
Long Trade: After 2 solid back to back green candles in a bearish parabolic trap
Stop Loss:
Always place your stop loss above the day’s high (for shorts) or below the day’s low (for longs).
Avoid keeping stop loss just above/below the reversal candle—it’s often hit by fake-outs.
Strategy 3 – Ultimate Supply and Demand Trading set up: Trade Only This High-Probability Setup”
“If someone were to ask me, ‘What’s the one intraday setup I should master?’ — without hesitation, I’d say: learn to trade supply and demand zones.
This setup not only works most of the time, but it also occurs frequently, making it one of the most reliable and repeatable strategies in intraday trading.”
Why Supply and Demand Work So Well in Intraday Trading
Most indicators lag, because they are derivative of price. Random trades are just that—random.
But supply and demand zones are rooted in real market psychology. These levels show where institutional money likely stepped in to buy or sell aggressively.
When price revisits these levels—especially after a big move—you can expect potential reversals or at least big reactions.
It’s not magic. It’s logic and order flow.
How to trade High-Probability Supply and Demand Zones
Step 1: Use a 5 or 15-Minute Chart
Start with the 5-minute or 15 minute timeframe, which is ideal for price action analysis. Look for areas where price made sudden, aggressive moves previously.
These are your key zones for upcoming session.
Step 2: Look at Previous Sessions
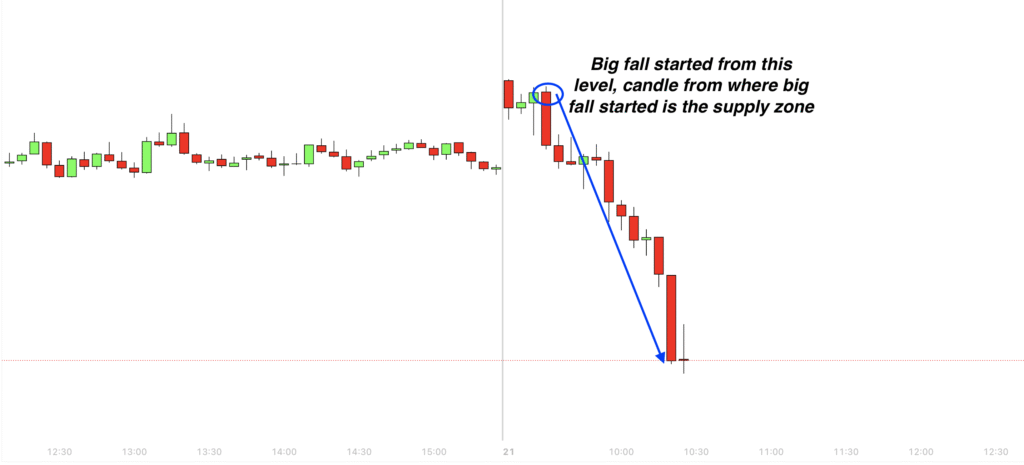
Go back to previous days—Thursday, Wednesday, Thursday if today is Friday—and identify where the biggest parabolic falls or rises happened in the past.
This is where the smart money moved the market.
For example, if Wednesday had a major drop from a certain level, that zone becomes your supply zone for coming session.
When price revisits that area of supply zone—same day or even days later—there’s a high chance of rejection or reversal.
Example: On 21st January, price was trading sideways for some time, then a massive bearish candle caused a free fall. That exact level becomes a strong supply zone.
Step 3. Don’t Get Trapped by Bullish Candles, wait for bearish candle to form
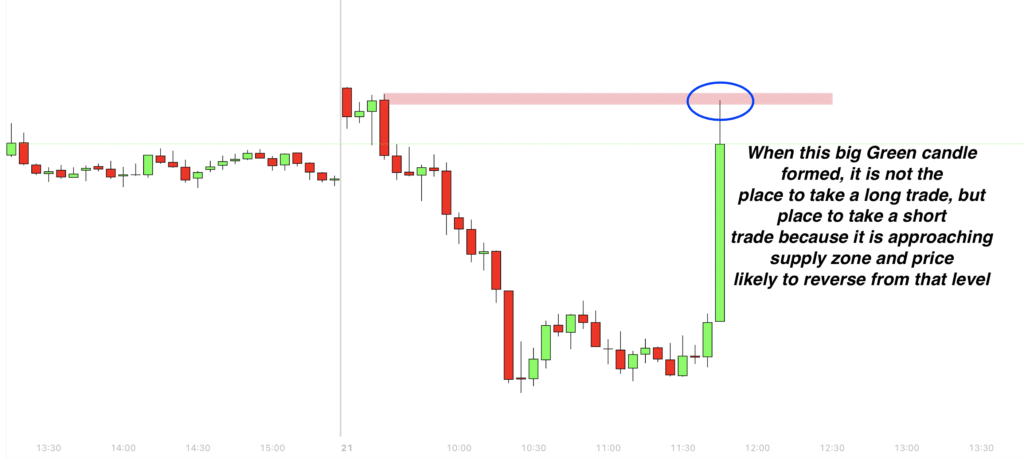
This is a key mistake many traders make: If they see a bullish candle forming at a supply zone and assume it is a breakout and it’s time to go long.
Wrong, it could be fake breakout.
Always check your left—look to the past. If there’s a confirmed supply zone there, that bullish candle might be a trap.
Price often fakes out traders before dropping again from that same level.
Example: As you can see in below image later in the session, on 21st January, price retested that supply zone with big green candle but that is not the place to enter long, but wait for reversal candle as you can see in the image when full body Red candle formed that is the place to short with stop loss above supply zone
Avoid Random Trades – Stick to the supply/demand Zones
One of the biggest improvements you can make in your intraday trading is to stop taking random trades. Instead, focus on taking trades near supply or demand zones.
If there’s no setup near a key level, skip the trade. High-probability trades don’t happen every 10 minutes—but when they do occur, they’re usually near these zones.
So if you’re still looking for that one setup that works most of the time, this is it. Forget the noise. Watch the levels. Let the market come to you.
Strategy 4 – Gap Border Reversal Strategy: A Hidden High-Probability Trading Setup for Nifty & Bank Nifty
“Markets Don’t Like Gaps”
If you’ve ever heard the phrase “Markets don’t like gaps”, then you’re already halfway to understanding the logic behind this strategy.
Markets often have a tendency to fill the gaps, and in doing so, they respect the edges of those gaps—what we call the gap borders.
What Is a Gap Border in Trading?
A gap in the market occurs when the price opens significantly higher or lower than the previous day’s range, leaving a visible “gap” between the two candlesticks on a daily timeframe.
How to Identify Gap Borders on Daily Charts
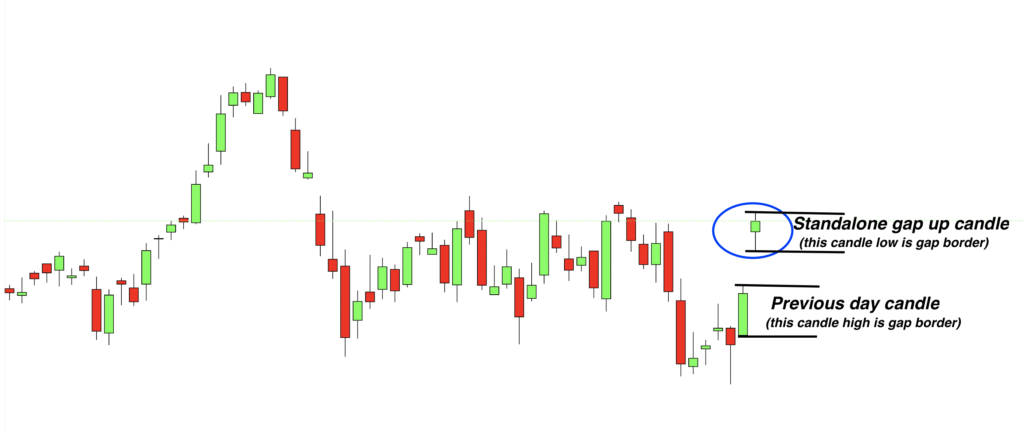
Find standalone gap candles—candles that opens and stay away from the previous day’s range for entire day.
Mark that standalone candle highs or lows. And they are gap borders which most of the time can work as strong support/resistance level.
Example: Daily time frame chart- In the below image, On 25th November 2024, Nifty formed a large gap-up candle. On 25th, the Nifty opened significantly higher, creating a gap from the prior day, The low of this candle, approximately around 51768, became our gap border
Step-by-Step Guide to Trading the gap borders
Step 1: Use the Daily Timeframe
Do not attempt to identify gaps on lower timeframes—it gets noisy and misleading. Always start on the daily chart.
Step 2: Spot a Standalone Candle
You’re looking for a candle that gaps away from the previous day’s range, such that:
It doesn’t overlap with the previous candle at all.
The gap is clearly visible and not just a wick.
Step 3: Mark the Border
If it’s a gap-up candle, mark the low of the candle.
If it’s a gap-down candle, mark the high.
This level becomes your key zones like support/resistance to watch for future price interaction
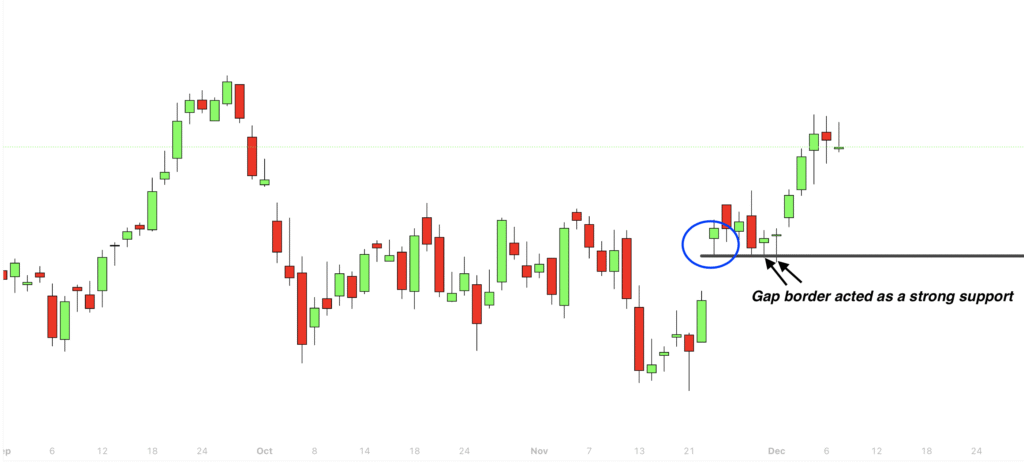
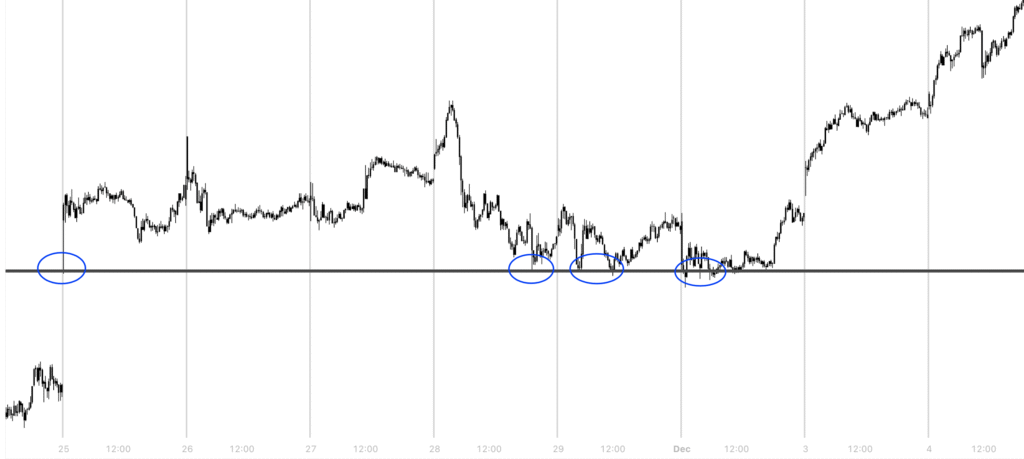
Example: in above image, in 5 minutes time frame chart- On 26th and 27th November, price stayed well above the gap, But on 29th November, price finally came down and touched the gap border.
What happened next? A sharp bounce from that exact level. Again, on 2nd December, price tested that level multiple times but couldn’t break it. It acted as a strong support, eventually leading to a massive upward move)
This is how gap borders act as magnets and walls—once price reaches them, they tend to reject price sharply, providing excellent risk-reward opportunities
Strategy 5: Most Traders Misunderstand CPR — A Powerful Intraday Setup
When it comes to intraday trading, few tools are as widely discussed—and as commonly misunderstood—one is Central Pivot Range (CPR).
If you’ve spent time reading trading books, or watching YouTube videos, you’ve probably come across the idea that a narrow CPR means a trending day.
But after trading the markets for over many years, I can tell you this:
A narrow CPR does not always mean a trending day.
Let’s start by busting the most common myth.
Many traders see a narrow CPR range in the morning and immediately assume the market is about to trend strongly. So they jump in with aggressive positions—long or short—expecting a big trending move.
But what happens? Price goes sideways for rest part of the day and Traders get trapped.
I’ve seen this happen countless times.
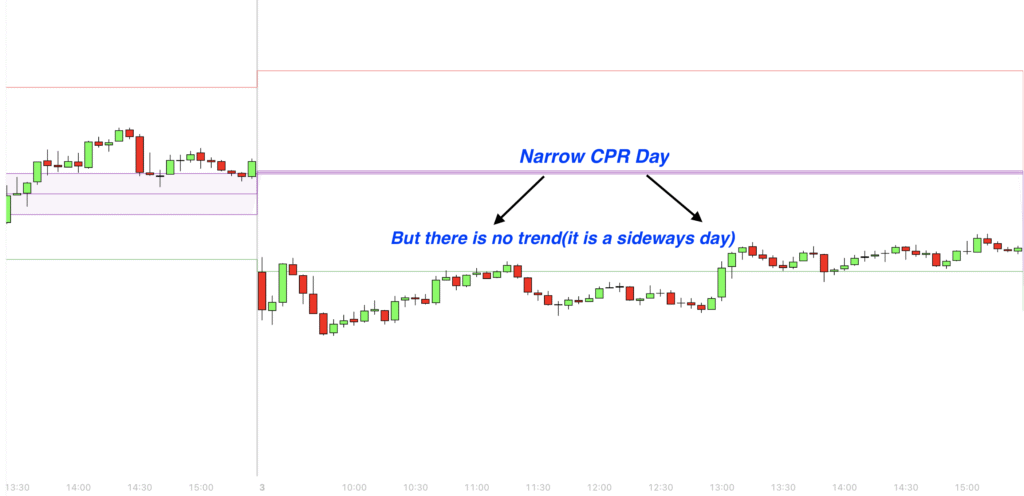
Narrow CPR may indicate a potential for volatility, but it does not guarantee a trending day. Often, the market remains range-bound, confusing anyone who expected a trending day.
Example: Below chart shows it was a narrow CPR day, but market stayed sideways for entire day, there was no trend.
What Actually Works: CPR as a Reversal Zone
Instead of using CPR to predict whether it will be a trending day, use it for what it does best:
CPR works beautifully as a dynamic support and resistance zone.
Most of the time, price reacts at CPR, especially when it opens away from it and retraces back.
This makes it an ideal zone for intraday reversals—a pattern I’ve seen on for years.
Here’s how it works:
CPR Reversal Setup: Step-by-Step
Step 1: Mark CPR for the Day
Before market opens at 9:15 AM, mark the day’s CPR levels
Step 2: Wait for Price to Retrace
If the market opens above or below CPR, don’t rush in. Wait for the price to come back to CPR.
Step 3: Watch for Reversal Signals at CPR
Once price reaches the CPR zone, look for price action confirmations like:
Rejection wick or Bullish/Bearish engulfing candle or Pin bar inside the CPR
Step 4: Take the Trade
Enter a reversal trade based on confirmation candle.
Use a stop-loss few points above or below CPR levels to manage risk.
Example: As you can see in the below image, CPR acting as strong support when price reached that level
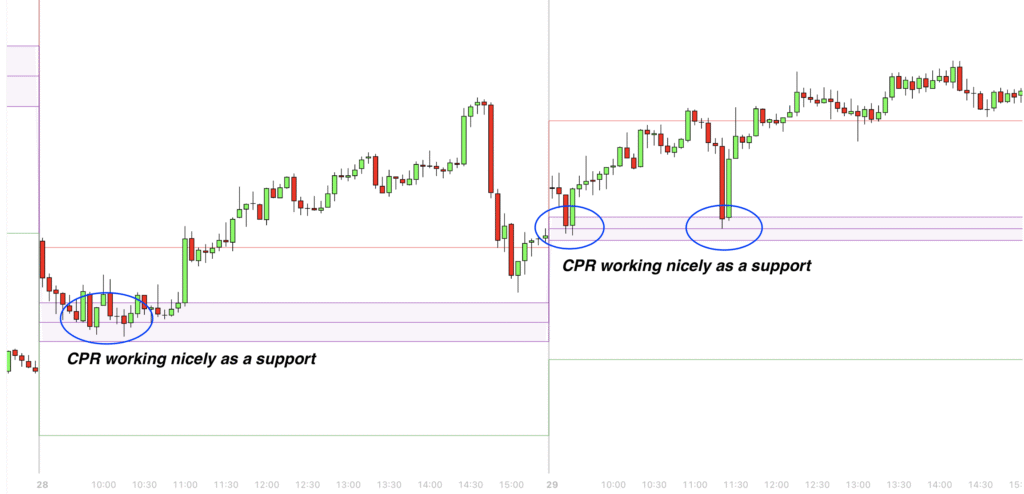
Note: While I don’t rely on narrow CPR as an indication of a trending day—because it often leads to misleading signals—But I have consistently observed that a wide CPR tends to result in sideways or range-bound price action.
So, while narrow CPR should not be used to predict trends, a wide CPR can often serve as a early indicator of a likely sideways day.
Conclusion
Two decades in the market have taught me one undeniable truth — The market doesn’t reward hope or guesswork. It rewards clarity, consistency, and calculated action.
If you’ve been trading without a plan, relying on luck or emotion, it’s time for a shift. Step away from gambling and step into the world of high-probability, pattern-driven setups.
Because real trading isn’t about chasing profits — it’s about mastering the process.


